We're going to give you some programs and workspaces to start with this time. First download a ZIP'ed copy of the Lab 5 workspaces and store it in the C:\FILES directory.
Now, go from the Start button into the MS-DOS prompt and execute the following commands:
Now we are going to use the debugger to step through your program. Warning: Debuggers are not easy to master, but you'll save yourself a great deal of time if you learn to use them.
Start the debugger by pressing the F11
key. You will see some flashing windows, but should finally
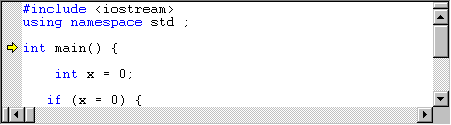
see a window that contains your program with
a small yellow arrow pointing at the line of code
the will be executed next.
Now press F10 to single step
through your code. Notice the yellow arrow move
as you tiptoe through the C code.
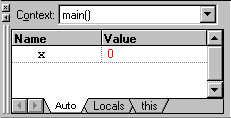
You may (depending on how
your Visual C++ is installed) also see
windows displaying values within your program.
It's best to stop when you get to the closing
curly brace.
You should stop the debugger with the menu selections Debug » Stop Debugging or the shift-F5 key combination. However, there's a good chance that you'll someday you'll go to far and find yourself debugging some Intel assembly code. If you see something like "add esp,0Ch", you should immediately shift-F5 to stop the debugger.
Now set the value assigned to x in its declaration to 1, rather than 0. Now step through the program and see if you execute the other branch of the if-then-else.
What? You didn't. Well, there's a bug in your program. Fix it.
Start debugging with F11 key and then use F10 to step through the code. The interesting twist occurs when you get to the input statement:
If you want your input characters echoed as you type them, you must type the F10 after the arrow reaches the input statement. If you go back to the console while the arrow is sitting on the input statement without pressing F10, you will not see the characters you type.
Continue to step through the program until you reach the end.
Use your mouse to move the cursor to the program statement
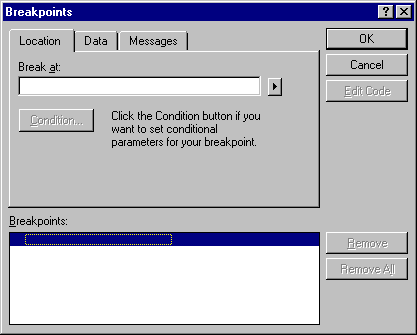
A red dot should appear just to the left of
the line you chose.
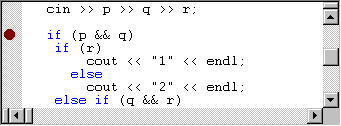
Now press the F5 key or use the menu choices Build » Start Debug » Go to begin execution of your program. Your code should be executed up to the breakpoint you just set. At that time, you should see the yellow arrow on top of the red dot. At that point, you can continue to use F10 to single step or you can return to warpspeed with F5.
Note to lab instructors: If time is running short, drop this part of the lab.