Your Assignment ...
More on references
Open References2.java and compile and run the program.
Now that you've run the program and seen the output, study the
code and try to understand what is happening.
Wouldn't it be helpful to see the Java code be executed a
line at a time?
This is something we can do with the debugger.
A debugger can step through your program code one line at a time
while you examine the values of your program variables.
You can also set a breakpoint on a line
of code of your program. Your program executes normally
until it reaches the breakpoint at which point the program
is halted so that you can examine its variables.
Setting a breakpoint
Let's start by setting a breakpoint in the
Reference2 class.
Do this by placing your cursor
anywhere within the line that says:
System.out.println ("Enter a teacher rating...");
Next right click while the cursor remains on the
line of Java code. You should see a new
pulldown menu.
Select Toggle Breakpoint from the menu.
A pink rectangle should now surround the selected line.

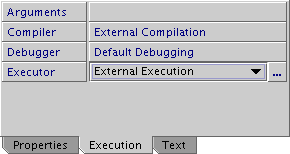
Setting the debugging main class
Because we have more than one class with a main
method, we're going to choose a specific main class for the debugging project.
This isn't stickly necessary, but it will decrease your chances
of going astray during this lab.
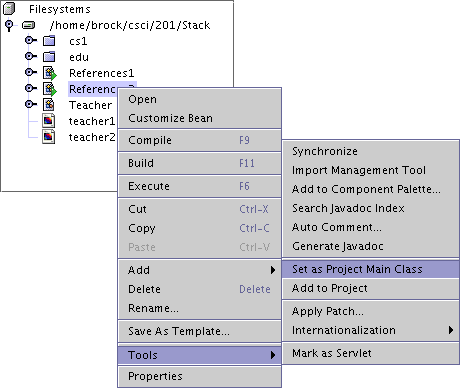
Make this choice by going into the Explorer panel and right clicking on
the Reference2 icon.
In the displayed menu select Tools and then
Set as Project Main Class.
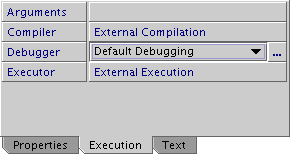
Starting the debugger
You can start debugging from the
Project pull-down menu by selecting
Debug Project.
or you can just select the Run in Debugger button,
 .
.
Your program starts, screen flash, and soon you should see
that the line with the breakpoint now has a green background
and is the target of a little green arrow. Your breakpoint
has been reached.
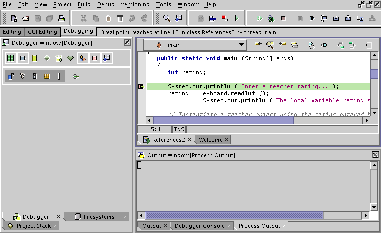
The debugger window
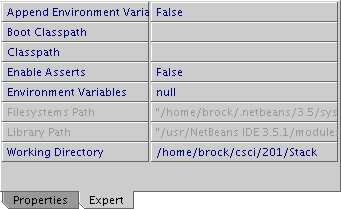
Be sure that the left panel is displaying the
Debugger Window. If not, select
the Debugging tab.
At the top of the Debugger Window is a line of nine
icons.
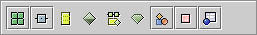
Start by turning off all of these nine selections, so that
your icons display as below. These icons control your view of
your program and its variables. We're going to experiement
with these controls. In the following few paragraphs
turn on and off each icon to see its effect. By the way,
it is possible to have several icons selected simultaneously.
Debugger view controls
 The first icon
shows the status of your debugging sessions.
If should show that your References2 session has
been stopped on a breakpoint.
It is unlikely that you will ever intentionally have
more than one active debugging session while a student
in this course.
The first icon
shows the status of your debugging sessions.
If should show that your References2 session has
been stopped on a breakpoint.
It is unlikely that you will ever intentionally have
more than one active debugging session while a student
in this course.
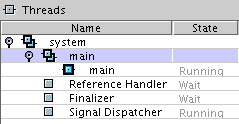
 The second icon
shows the status of your program's threads.
It is possible to have more than one Java interpreter simultaneously
executing the methods of your program. In fact, multi-threaded
applications are required for interesting multi-media applications
and you have undoubtedly encountered many on the web.
Right now, your application may appear to have only one thread,
but push down on those expanders, and you'll see more.
The second icon
shows the status of your program's threads.
It is possible to have more than one Java interpreter simultaneously
executing the methods of your program. In fact, multi-threaded
applications are required for interesting multi-media applications
and you have undoubtedly encountered many on the web.
Right now, your application may appear to have only one thread,
but push down on those expanders, and you'll see more.
 The third icon
shows your call stack. This can be used to determine the
series of method calls that were made to reach the breakpoint.
The third icon
shows your call stack. This can be used to determine the
series of method calls that were made to reach the breakpoint.
 The fourth icon
displays the local variables of a active method invocation.
It is possible, though rarely advisable, to change the value
of a variable in this display.
Because an object may be passed between method, it may
appear in many different method invocations.
The fourth icon
displays the local variables of a active method invocation.
It is possible, though rarely advisable, to change the value
of a variable in this display.
Because an object may be passed between method, it may
appear in many different method invocations.
 The debugger may be working on several sessions.
Each session may be executed by several threads, each with its own
call stack.
Each call stack may have several method invocations, each with its
own set of local variables.
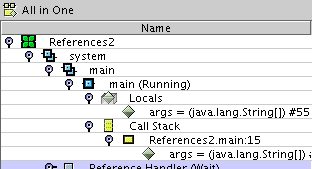
The fifth icon, called All in One, puts this entire
hierarchy into a single display.
Press the expanders in the All in One window to
descend to the depths of your Java program.
The debugger may be working on several sessions.
Each session may be executed by several threads, each with its own
call stack.
Each call stack may have several method invocations, each with its
own set of local variables.
The fifth icon, called All in One, puts this entire
hierarchy into a single display.
Press the expanders in the All in One window to
descend to the depths of your Java program.
 The sixth icon controls watches.
A watch is a variable the debugger is actively tracking.
This used with a programmer thinks a particular variable is
causing problems and requires special attention. The value of
that variable is displayed in the watch list.
The sixth icon controls watches.
A watch is a variable the debugger is actively tracking.
This used with a programmer thinks a particular variable is
causing problems and requires special attention. The value of
that variable is displayed in the watch list.
 The seventh icon allows you to lists the fields, constructors,
and methods of your active classes. Many classes are within
packages and you must descent through the class hierarchy to uncover them.
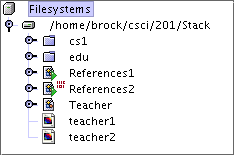
Press the Classes icon. Notice that the class
Teacher is not displayed. That's because
your program has yet to instantiate an object of class Teacher.
The seventh icon allows you to lists the fields, constructors,
and methods of your active classes. Many classes are within
packages and you must descent through the class hierarchy to uncover them.
Press the Classes icon. Notice that the class
Teacher is not displayed. That's because
your program has yet to instantiate an object of class Teacher.
 The eighth icon provides a quick list of breakpoints.
 The ninth icon is for properties, a mechanism for internationalizing
the text displayed by a Java application. You won't use them here.
The ninth icon is for properties, a mechanism for internationalizing
the text displayed by a Java application. You won't use them here.
Stepping through the code
When you reach a breakpoint, you can start stepping through the
code. For each line of code, you can either:
-
 Step over the line: Proceed to the
directly next line of code.
Step over the line: Proceed to the
directly next line of code.
-
 Step into the line: Start stepping
through the various methods invoked by that line.
Step into the line: Start stepping
through the various methods invoked by that line.
-
 Step out of the method containing the line:
Return to the calling method.
Step out of the method containing the line:
Return to the calling method.
-
 Stop stepping but continue
executing the program until it terminates or encounters another breakpoint.
Stop stepping but continue
executing the program until it terminates or encounters another breakpoint.
-
 Stop stepping and finish debugging, presumably
to fix your code.
Stop stepping and finish debugging, presumably
to fix your code.
Stepping through the References2
Presumably your debugger is still waiting at the breakpoint.
Go into the Local Variables view where you should see
nothing put a single variable args.
Now lets do some debugging. Use the
Step Over button,
or
F8 key,
to execute the current line of code and advance to the next.
Notice the prompt for input in the output window.
Notice also that
you can't advance until you provide that input. Enter a value for rating
and see its value in the local variables display.
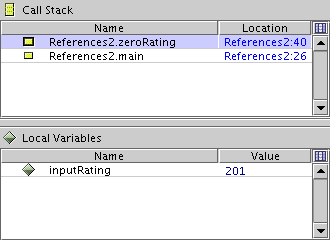
Contine to step over lines of code until the first call to the
zeroRating() method is highlighted. By now,
you should have a teacher reference variable
in the local variables display. Click the expander to
teacher to view its instance variables.
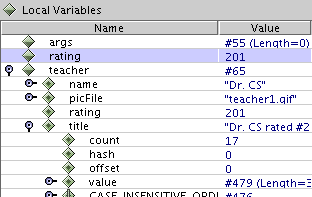
Note
that some of the instance variables are also references to objects
that can be viewed. Explore all reference variables and make sure
that you understand what you see.
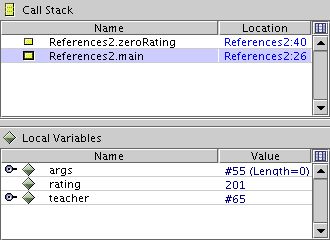
Now use the Step Into button, or the
F7 key, to step into the
zeroRating() method. Display both the call stack and
local variables windows and switch between the two sets of local
variables by choosing between the two frames of the call stack. You
choose a frame by double-clicking on that frame in the call stack.