CSCI 201 Lab 9 -- Reference Variables
In this lab you work with reference variables and the jGRASP debugger.
Getting started
Retrieve the jar file from this link and
store it in csci/201.
Extract the files to create
the directory csci/201/Lab09,
then open the Lab09.gpj jGRASP project file.
If you can't get unjarred, consult
Downloading a Java
archive from Lab 2.
References
The file Teacher.java defines a simple class that represents a
teacher (a teacher has a name, a picture, and a rating).
The file References1.java contains a program that instantiates
two Teacher objects and then makes some modifications to the objects
and their references. Your job is to complete that program as described
in the comments in References1.java. There are three modifications
that you are asked to make and there is a checkoff below for each of
these three modifications.
Checkoff for swapping reference variables
Show your lab instructor your code for swapping reference
variables along with the displays of both the original and
the "swapped" teachers.
Checkoff for swapping object names
Show your lab instructor your code for swapping the objects'
names along with displays of the teachers both before
and after "swapping" their names. (Be sure to comment out
all other displays.)
Checkoff for swapping object names
Show your lab instructor your code for swapping the objects'
ratings along with displays of the teachers both before
and after "swapping" their ratings. (Be sure to comment out
all other displays.)
More on references
|
Open References2.java and compile and run the program.
Now that you've run the program and seen the output, study the
code and try to understand what is happening.
Wouldn't it be helpful to see the Java code be executed a
line at a time?
This is something we can do with the debugger.
First, we must recompile the program in debug mode.
Use the Compile
⇒ Debug Mode
menu path to enable debugging. Then re-compile your program.
|

|
|
Now you must set a breakpoint in your program to interrupt
normal program execution. Do this by clicking your cursor
anywhere within the line that says:
System.out.println ("Enter a teacher rating...");
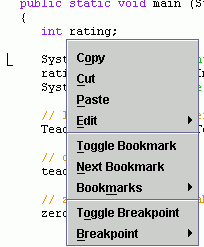
Next right click within the CSD window. You should see a new
pulldown menu.
Select Toggle Breakpoint.
A red circle should appear to the right of the selected line.
Be careful not to select
Toggle Bookmark.
|
|
Making a break
Press the debug icon,  ,
or use the Run
⇒ Debug menu choice, to
start executing your program with the Java debugger.
Make sure the Debug tab is selected in the right pane.
You should see four separate displays in this pane.
|
The first is a row of debugging control icons. Move your
mouse slowly across this row to get a brief description of
what each does. We'll use the leftmost icon
to start with. Each time it is clicked, one statement
of your program will be executed.
|

|
|
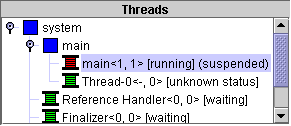
The next is a display of threads.
Java can use thread to simultaneously execute several methods.
This is important in networking and animation applications
and you may learn to write multi-threaded Java code in
upper-level CSCI courses.
|
|
|
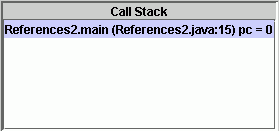
The third display is the call stack. Right now you see that
the main method of class References2 is
being executed. This display gets more interesting when
methods call other methods.
|
|
|
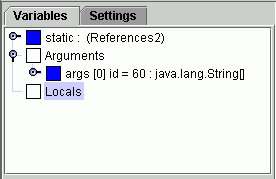
You'll notice that the final display has two tabs. Presently you
should be on the variables tab. This display will
probably be the most helpful to you because it shows you the values
of the variables being used by your class and method.
|
|
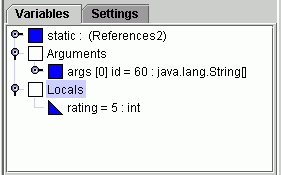
Now lets do some debugging. Use the  icon to execute the current line of code and advance to the next.
Notice the prompt for input in the I/O window; notice also that
you can't advance until you provide that input. Enter a value for rating
and observe its value in the Variables display.
You will have to click the magnifying glass for Locals
 to open that display.
Advance using  until
the first call to the zeroRating() method is highlighted.
Again check the Variables display and observe the
representation of the Teacher object. Click the
magnifying glass for that object to view its
instance variables. Note that some of the instance variables
are also references to objects that can be viewed.
Explore all reference variables and make
sure that you understand what you see.
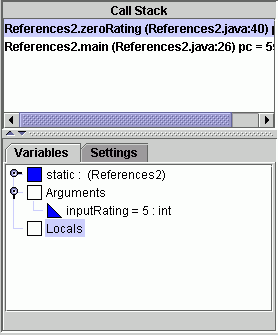
Now advance using the  to "step in" to the zeroRating() method. Notice the change
to the Call Stack and the Variable
display.

Select References2.main(...)... in the Call Stack
and observe that you can still view the variables belonging to
main(). Why is inputRating displayed under
Arguments?
Advance to the "}" marking the end of the zeroRating() method.
jGRASP debugging checkoff 1
Show your lab instructor the variables in both zeroRating()
and main(). Explain why the value of rating
in main() is not changed by the call to
zeroRating().
Advance until the second call to zeroRating() is highlighted,
and then "step in" to zeroRating(). Again, observe the
Call Stack and the Variable display. Click
the magnifying glass to view the object referenced by the
argument inputTeacher.
Advance to the "}" marking the end of this zeroRating() method.
jGRASP debugging checkoff 2
Show your lab instructor the variables in both zeroRating()
and main(). Explain why the Teacher
object created in main() is
changed by the call to zeroRating().
That's all folks.
Go home.


 icon to execute the current line of code and advance to the next.
Notice the prompt for input in the I/O window; notice also that
you can't advance until you provide that input. Enter a value for rating
and observe its value in the Variables display.
You will have to click the magnifying glass for Locals
 to open that display.

 to "step in" to the zeroRating() method. Notice the change
to the Call Stack and the Variable
display.
