As you may recall, Booksite2.jar is organized into packages. So remember that you will need to include import statements, as for example
import stdlib.*;
For your convenience, complete methods that implement both of these algorithms are already available to you in a class named Permute.java, which you should now download into the default package for Lab14. Note that this is not a textbook demo or library class, so you will need to get it from the link above. You will want to scan Permute.java to figure out its API, but your real task here is to develop a client application that makes performance tests of the two methods in Permute and compares their running times as a function of the parameter n.
To get started, create a new main class named Performance in the default packge for Lab14. Then start to fill in its main() method by copying the following code:
int n = Integer.parseInt(args[0]);
Stopwatch timer = new Stopwatch();

double tstart = timer.elapsedTime();
int [] p = Permute.permute1(n);
double t = timer.elapsedTime() - tstart;

System.out.printf ("Elapsed time (sec) = %10.6f\n", t);
Study the code a moment. Note in particular the first red-lined statement, which refers to a class Stopwatch. The problem at the moment is that the compiler does not recognize this class. Stopwatch is a textbook demo from Chapter 3, which has in fact been included in the JAR file Booksite2.jar for your convenience. But the compiler will not know where to find Stopwatch until you add the line
import chapter3.Stopwatch;
Otherwise, please resume your meditations on this code. It will not surprise you that Stopwatch models a stopwatch. But make sure that you see how the code listed above creates a Stopwatch instance and then uses its elapsedTime() method to find the time required to generate a single permutation of [0,n).
The problem here is that computers tend to be so fast that time scales of seconds or milliseconds are much too coarse for accurate performance measurements of many common tasks. However, there is a way to improve on these measurements, which is simply to measure the time it takes to perform the same task multiple times in a row, and then compute an average time by dividing the total time by the number of repetitions. The key here is to make the total time interval long enough to measure reliably.
You can easily make this refinement by inserting a repetition loop around the method to be tested, as in the code fragment shown below:
double tstart = timer.elapsedTime();     // ms

for (int r = 0; r < reps; r++) {
    int [] p = Permute.permute1(n);
}
double t = (timer.elapsedTime() - tstart) / reps;
Of course the variable reps, specifying the number of repetitions, must be defined somewhere. For the purposes of this project, you should provide this value as another command-line argument.
So make these changes, then rebuild the project and repeat your experiments. You should go back to relatively small values of n, for which you were getting 0.000000 times in the first version. See if a large number of repetitions per trial makes a difference. Also perform several trials in a row using the same values of n and reps, then increase reps while keeping n fixed and perform several more trials. Try to determine whether your results for fixed n actually vary less from trial to trial as you increase reps.
After you have drawn some conclusions from your latest results, show your results to your lab instructor.
In a nutshell, you can do this easily if you surround the code you have written so far in a loop that lets n range over multiple values. A flexible way to set up this loop is to provide three separate parameters, namely
- An initial value of n, say ni.
- A final value of n, say nf, which specifies when to terminate the loop.
- An increment (step size) dn, which is added to n after each loop iteration.
Using these variables, the loop control might be written as follows:
for (int n = ni; n <= nf; n += dn)
Make these changes, rebuild, and run the project. For starters, you might try letting ni = 1000, nf = 10000, and dn = 1000. The repetition count reps should be fairly large, so try a starting value of at least 1000. But you should certainly experiment a bit with these numbers.
Before you proceed, demonstrate your latest version to your lab instructor.
Whenever you start to make a graph, one of your first decisions is about scaling, or choosing suitable ranges for the x and y axes. For the data generated by Performance, we should not really all that interested in the absolute running times t or particular values of n. What should be of concern is the trend shown by this data, namely, how fast does the running time increase with increasing n? So in this application it is all right to scale the axes to any convenient range. Hence you might as well use the default range that StdDraw assumes for both axes, namely [0,1].
Of course you do want the data points to show up in the graph, so they will have to be rescaled to match these defaults. Since the running time t(n) is a monotonically increasing function of n, this is an easy task: simply divide each value of n by its final (maximum) value, and then do likewise for each value of t. But since the maximum values of n and t are the last values generated in the outermost loop, you will have to revise Performance so that it saves all the values of n and t as it computes them, rather than throwing them away as it does now. The best way to accomplish this is to replace the single variables n and t with arrays, so that each iteration of the outermost loop generates matching components n[i] and t[i]. You may also want to rewrite the loop itself, so that it is based on an index variable i that labels each data point, rather than n. Thus the line
for (int n = ni; n < nf; n += dn)
for (int i = 0; i <= imax; i++)
int imax = (nf - ni) / dn;
n[i] = ni + i * dn;
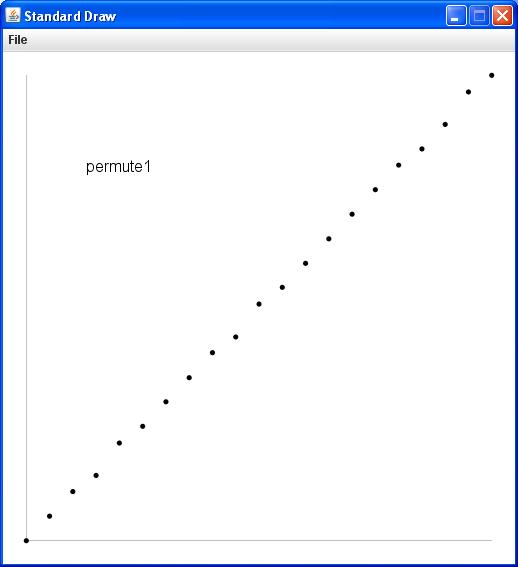
The argument values used to generate this example were ni=0, nf=10000, dn=500, and reps=1000. Also, the label permute1 was displayed by adding the line
StdDraw.text (0.2, 0.8, "permute1");
Your final plot should at least vaguely resemble the image shown below:
When this part is ready, show your results to your lab instructor. You might be asked to draw some conclusions from your latest results, but otherwise you have successfully completed the final lab project for the semester. Congratulations!